If you believe that graph and network visualization is a kind of art, this post was written for you. If you believe that it isn’t, then you should also keep reading. Since we love using graph-based methods in our work, like generating more labeled data, visualizing language acquisition and shedding light on hidden biases in language, we started a series on graph theory and network science. The first part was devoted to the theoretical background of graphs and how to deal with them using Python, while the second part was about graph databases and analytics engines. Now we turn to graph and network visualization.
Getting started with your first graph viz
There are plenty of visualization tools easily available on the web, so it could be tempting to simply put your graphs into one of those tools to generate a good looking viz. But there are a few questions you should ask yourself before you make a network viz.
- How large your network is?
- Is it meaningful to show all the nodes and edges?
- What’s the best way to filter out elements of the graph?
- What aspects of the data do you want to show? How network layout can support this?
The bigger your network is, the harder to present it without filtering. If you let your users filter the data, you accept that it might take time to re-process it. You also assume that your users know a lot about networks and understand concepts like degree range and edge weight.
Filtering
Filtering can be done manually based on some measure, like centrality measures, degree range, and edge weight. Or it can be done automatically using backbone extraction. We strongly recommend automatic filtering, especially in case of language graphs. Read this paper to get a gasp of it and check out this repo to see a Python implementation of it using NetworkX.
Layouts
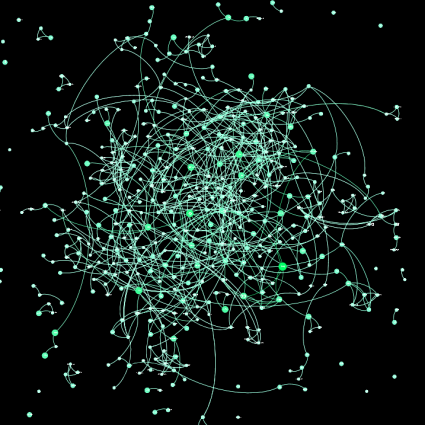
The most common way to visualize graphs is to use force-directed layout algorithms. These are very close to the common concept of graphs. They show the nodes and the edges and give a general overview of the relations among its elements. The size and color of nodes and edges can encode lots of information. It’s worth going through the most common graph drawing methods before one chooses the best layout to present the data. Note that these methods are developed for small and mid-sized networks.

Using hive plot or a hive panel (a collection of hive plots) can be a good choice for mid and large-sized networks.

Sometimes a heatmap based on the matrix representation of the network is even more appropriate.

The Handbook of Graph Drawing and Visualization is the best source to get ideas on how to visualize your networks. Sadly, only a few methods described in it have been implemented into open source projects yet.
You can consider 3D visualization techniques too. Three dimensional vizs look great, but it is very hard to use them for exploring the data. If you’d like a cool 3D graph, render it using FUEL algorithm developed by Barabási and his colleagues.
Tools
Gephi

Gephi is the probably the most well-known graph visualization tool. It supports many graph file formats and you can enhance it with super-cool plugings. You don’t have to be a programmer to use it, and within a few minutes you can find tutorials to learn how to become a professional user.
You can turn your static Gephi viz into an interactive web-based one using the JavaScript GEXF Viewer for Gephi tool.
D3
You can find almost every graph drawing method in D3. Since D3 is a JavaScript library, you should be good at JS, HTML and related technologies to fully master it. However, you can easily find examples on the web which can be tailored to your needs.
Three.js
Three.js is a JavaScript library for creating and displaying 3D objects and animations. It is an obvious choice for 3D data visualization if you are good at web programming.
Vasco Asturiano’s 3D Force-Directed Graph project is a good compromise if you don’t want to deal with the nuances of Three.js.
What’s coming up next?
The last part of this series will be about Graph Neural Networks. What can they offer to us and which tools to use? Stay tuned!
Hire Us
Do you need a good and user-friendly network visualization? Do you want to build a knowledge graph for your applications? Do you need an AI or an NLP expert to consult with? Contact us and we’ll help you!
Make a one-time donation
Make a monthly donation
Make a yearly donation
Choose an amount
Or enter a custom amount
Your contribution is appreciated.
Your contribution is appreciated.
Your contribution is appreciated.
DonateDonate monthlyDonate yearlyDo you like our visualizations? Buy them for yourself!
Visit our shop on Society6 to get a printout of our vizs.


This work is licensed under a Creative Commons Attribution-NonCommercial-ShareAlike 4.0 International License.
This work is licensed under a Creative Commons Attribution-NonCommercial-ShareAlike 4.0 International License.