Although we love QGIS we prefer programmatic solutions when we have to visualize data. The Python ecosystem offers excellent tools to produce interactive and static maps. We tested Altair and Folium on the same dataset.

We are not GIS experts, so we go for easy-to-use solutions whenever we have to work with geodata. QGIS is a fantastic open source software that brings digital mapping to the masses for free. Its plugins make online mapping a blast. However, we prefer programmatic solutions because they are more flexible. The geopandas package extends pandas with geospatial capabilities, allowing one to work with panadas-like dataframes. The geopandas package works well with the two main mapping tools, Altair and Folium. Using Altair is simple, one can build interactive maps within a few hours. The only downside of Altair is the limited ability of customization. Folium unites the data processing capabilities of Python with Leaflet.js, the best open source web mapping tool. The package allows you to make fully customized maps, but this comes with a steeper learning curve.
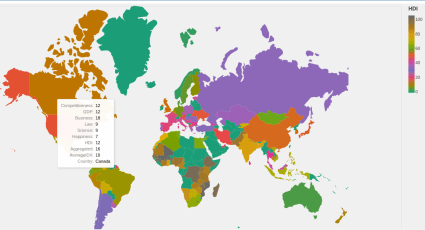
We made Altarir– and Folium-based interactive maps using our country rankings dataset. The code base of the project can be found on GitHub.
Make a one-time donation
Make a monthly donation
Make a yearly donation
Choose an amount
Or enter a custom amount
Your contribution is appreciated.
Your contribution is appreciated.
Your contribution is appreciated.
DonateDonate monthlyDonate yearlyDo you like our visualizations? Buy them for yourself!
Visit our shop on Society6 to get a printout of our vizs.


This work is licensed under a Creative Commons Attribution-NonCommercial-ShareAlike 4.0 International License.