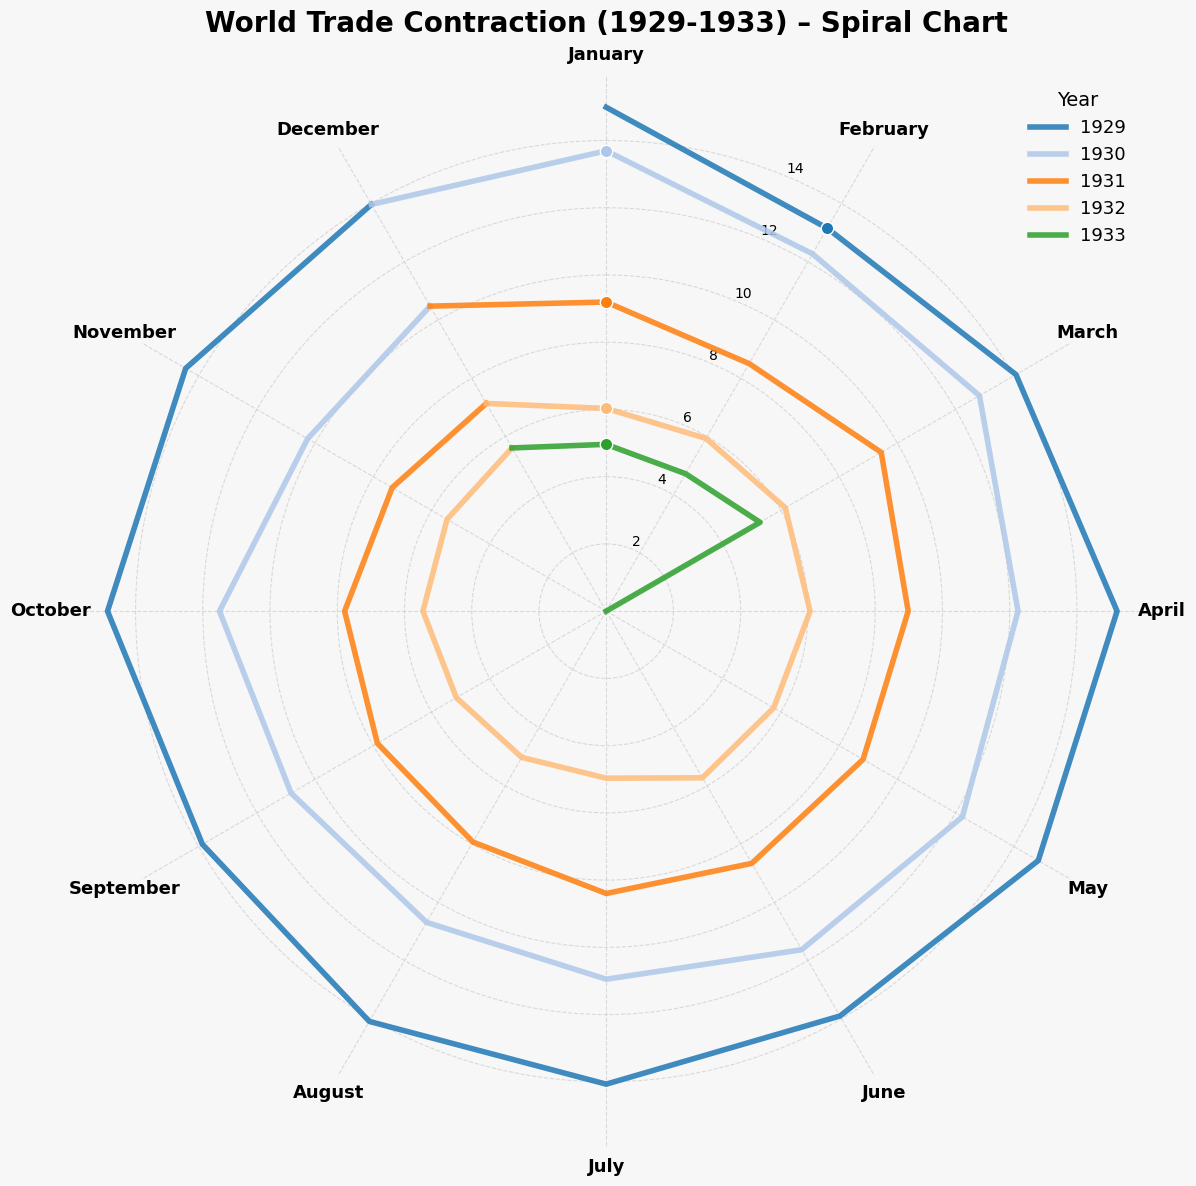
I recently recreated Charles Kindleberger‘s famous “spiral” chart using Python – a powerful visualization that dramatically illustrates how global trade collapsed between 1929 and 1933, resembling “water circling a drain.”
My inspiration came from a fascinating article in The Economist that highlighted how this decades-old visualization has gained renewed relevance in today’s discussions about trade policies and global leadership.
What is the Kindleberger Spiral?
This iconic visualization was created by economic historian Charles Kindleberger in his 1973 book “The World in Depression.” The spiral tracks month-by-month how global trade contracted during the Great Depression as nations turned to protectionism, with devastating consequences.

Why it Matters Today
Kindleberger’s insights remain surprisingly relevant. His concept of the “Kindleberger gap” – the leadership void that emerges when no nation is willing or able to stabilize the global economy – speaks directly to our current geopolitical tensions and trade uncertainties.
As Kindleberger argued, economic stability is not a naturally occurring equilibrium but a global public good that must be actively maintained by leading economies. When this leadership falters, we risk repeating patterns from the past.
The Technical Challenge
Recreating this visualization was an interesting process. Since the dataset is relatively small, I simply typed the historical trade figures into a Google Sheet and saved it as a CSV file—sometimes the simplest approach works best!
Though I’ve always been fascinated by polar charts, implementing one in Python took some time to figure out. The coding process became a journey through both technical challenges and economic history, translating numbers into a visual story that’s impossible to ignore.
I took the liberty of modifying Kindleberger’s original design by adding different colors for each year (1929-1933), which I think helps highlight the progression of the trade collapse over time.

The Kindleberger spiral reminds us that history offers clear warnings about the consequences of economic nationalism and leadership voids in global affairs.
The complete Python code is also available on our GitHub repository for those interested in recreating or building upon this visualization.
Leave a Reply